Fantastic, fantastic racing over the weekend in San Diego. Like, amazing. Ken Roczen and Ryan Dungey went toe-to-toe for 20 24 laps and matched each other stride-for-stride, which was amazing. Just before that, the 250s offered up a nail-biter, with Jimmy Decotis checking out early, Martin Davalos taking the lead, then Shane McElrath bringing the fight to him. But just when it looked like a two rider fight for the win, Justin Hill and Aaron Plessinger came out of nowhere to make it a four-rider battle!
Let’s dive into the lap data to figure out how these races were won and lost with this week’s Sign of the Lap Times. First, our traditional lap time charts.
450SX Class Lap Times
| Lap Rank | Finish | Best Lap | In Lap | Avg Lap Time | Rider |
| 1 | 2 | 52.490 | 5 | 53.725 | Ryan Dungey |
| 2 | 1 | 52.623 | 8 | 53.576 | Ken Roczen |
| 3 | 3 | 52.882 | 6 | 54.448 | Marvin Musquin |
| 4 | 4 | 53.485 | 5 | 54.674 | Jason Anderson |
| 5 | 6 | 53.516 | 5 | 55.288 | Eli Tomac |
| 6 | 5 | 53.561 | 3 | 55.225 | Cole Seely |
| 7 | 20 | 53.799 | 9 | 56.980 | Blake Baggett |
| 8 | 9 | 54.206 | 7 | 55.655 | Chad Reed |
| 9 | 7 | 54.242 | 5 | 55.288 | Weston Peick |
| 10 | 8 | 54.331 | 3 | 55.576 | Davi Millsaps |
| 11 | 10 | 54.456 | 7 | 56.177 | Justin Bogle |
| 12 | 11 | 54.626 | 16 | 56.318 | Josh Grant |
| 13 | 12 | 54.781 | 8 | 56.531 | Dean Wilson |
| 14 | 14 | 55.099 | 6 | 56.510 | Cooper Webb |
| 15 | 16 | 55.249 | 10 | 57.124 | Jake Weimer |
| 16 | 13 | 55.367 | 5 | 56.953 | Broc Tickle |
| 17 | 15 | 55.604 | 5 | 57.549 | Vince Friese |
| 18 | 17 | 55.650 | 9 | 57.463 | Justin Brayton |
| 19 | 18 | 55.807 | 3 | 58.999 | Tommy Hahn |
| 20 | 19 | 56.083 | 5 | 59.247 | Fredrik Noren |
| 21 | 21 | 58.309 | 5 | 1:03.906 | Cade Clason |
| 22 | 22 | 58.534 | 3 | 1:02.888 | Alex Ray |
250SX Class Lap Times
| Lap Rank | Finish | Best Lap | In Lap | Avg Lap Time | Rider |
| 1 | 3 | 53.658 | 7 | 55.210 | Aaron Plessinger |
| 2 | 1 | 53.690 | 6 | 55.215 | Shane McElrath |
| 3 | 2 | 53.729 | 7 | 55.136 | Justin Hill |
| 4 | 5 | 53.809 | 7 | 56.345 | Austin Forkner |
| 5 | 6 | 53.811 | 2 | 56.963 | Jimmy Decotis |
| 6 | 4 | 53.981 | 3 | 55.603 | Martin Davalos |
| 7 | 17 | 54.592 | 3 | 58.253 | Dan Reardon |
| 8 | 7 | 55.026 | 8 | 56.049 | Jeremy Martin |
| 9 | 8 | 55.591 | 8 | 57.660 | Phil Nicoletti |
| 10 | 11 | 56.253 | 4 | 58.271 | Tyler Bowers |
| 11 | 9 | 56.368 | 7 | 57.470 | Hayden Mellross |
| 12 | 21 | 56.704 | 6 | 58.820 | Bradley Taft |
| 13 | 12 | 56.747 | 4 | 58.663 | Cole Martinez |
| 14 | 19 | 56.781 | 2 | 1:01.453 | Zac Commans |
| 15 | 10 | 56.940 | 7 | 57.604 | Josh Hansen |
| 16 | 14 | 56.942 | 4 | 59.508 | Justin Starling |
| 17 | 13 | 57.473 | 5 | 59.062 | Chase Marquier |
| 18 | 15 | 57.724 | 10 | 59.082 | Scott Champion |
| 19 | 16 | 57.804 | 5 | 59.411 | Kyle Chisholm |
| 20 | 18 | 58.238 | 5 | 1:00.363 | Killian Auberson |
| 21 | 22 | 58.979 | 4 | 1:02.240 | Jon Ames |
| 22 | 20 | 59.499 | 6 | 1:02.806 | AJ Catanzaro |
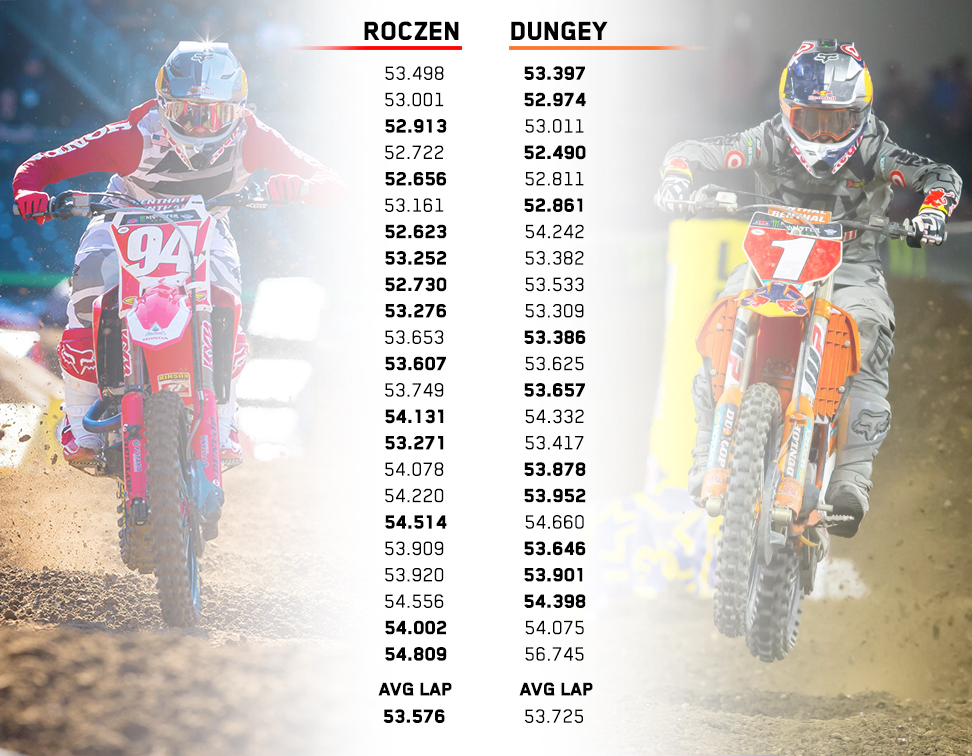
Now let’s get deep into the Roczen versus Dungey analysis. Here’s every lap laid together side by side. What’s most impressive? Their fast laps are split almost equally with Roczen taking 12 and Dungey taking 11.
Roczen vs Dungey 450 Main Event Lap Times
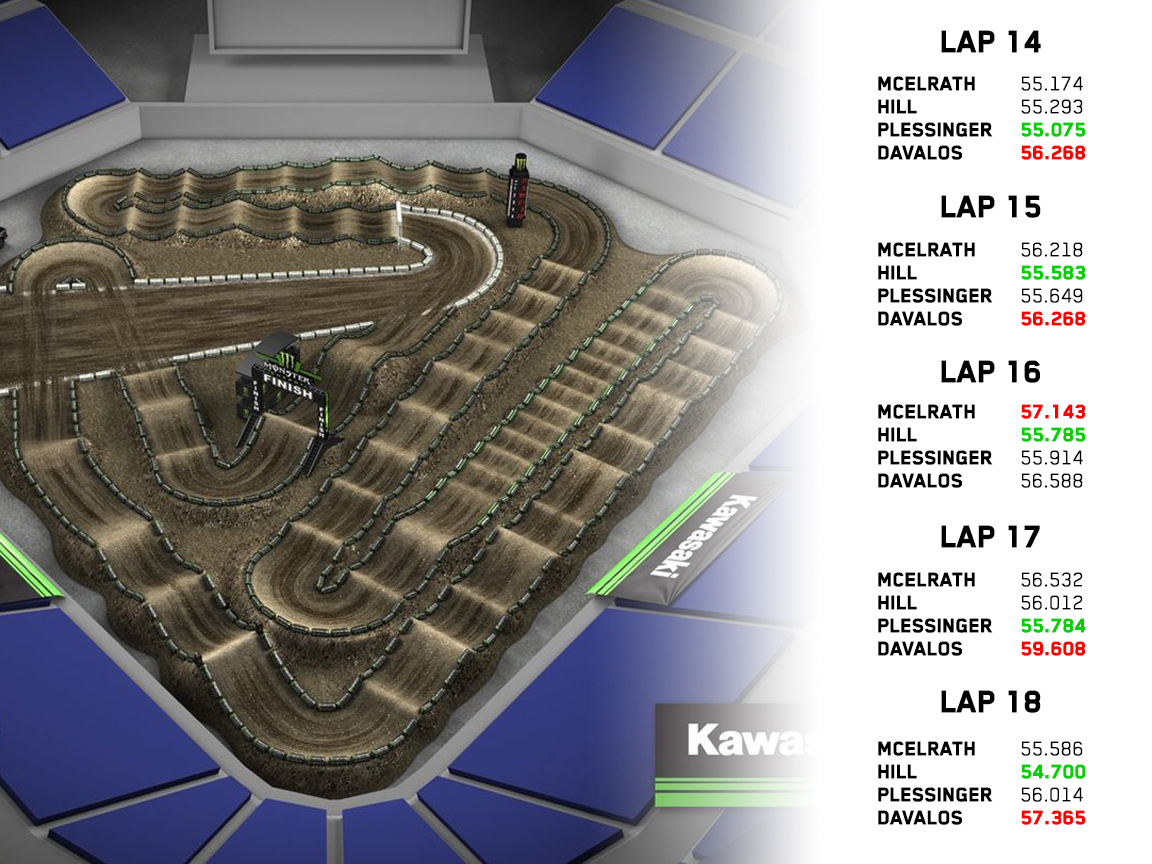
Onto the 250s. How did McElrath make the move on Davalos? How did Hill and Plessinger catch up? Here’s the data on the final few laps of a crazy 250 main.
McElrath, Hill, Plessinger, and Davalos Lap Times
In conclusion, the first-ever SX races to go beyond the traditional 15 and 20 lap distances were good ones. We’ll see if it keeps up.


