While we dropped the “Everything’s bigger in Texas” slogan a couple times last week, the track definitely wasn’t. Two sets of fast whoops and only one triple allowed lap times to dip into the low 50-second range. But does that really matter? With the new timed racing format, we still got 20 minutes of racing on a deceptive track and even saw a pit stop or two! This track was exactly why the 20-minute plus one format was implemented. Using Marvin Musquin’s average lap time of 50.018, we would have only seen 16 minutes and 40.2 seconds of racing under the old 20-lap format.
Let’s dive into the lap data to figure out how these races were won and lost with this week’s Sign of the Lap Times. First, our traditional lap time charts.
450SX Class Lap Times
| Lap Rank | Finish | Best Lap | In Lap | Avg Lap Time | Rider |
| 1 | 1st | 48.054 | 2 | 50.018 | Marvin Musquin |
| 2 | 14th | 48.613 | 2 | 50.684 | Cooper Webb |
| 3 | 15th | 48.914 | 3 | 53.582 | Eli Tomac |
| 4 | 3rd | 48.991 | 10 | 50.218 | Jason Anderson |
| 5 | 2nd | 49.180 | 7 | 50.116 | Cole Seely |
| 6 | 4th | 49.194 | 6 | 50.370 | Ryan Dungey |
| 7 | 5th | 49.411 | 11 | 50.713 | Dean Wilson |
| 8 | 9th | 49.456 | 5 | 52.122 | Justin Bogle |
| 9 | 8th | 49.665 | 6 | 50.538 | Davi Millsaps |
| 10 | 17th | 49.709 | 7 | 51.657 | Blake Baggett |
| 11 | 7th | 49.766 | 12 | 51.371 | Jake Weimer |
| 12 | 11th | 49.810 | 2 | 52.072 | Trey Canard |
| 13 | 19th | 49.882 | 8 | 51.426 | Chad Reed |
| 14 | 6th | 50.057 | 11 | 51.101 | Broc Tickle |
| 15 | 10th | 50.935 | 3 | 52.571 | Malcolm Stewart |
| 16 | 12th | 51.013 | 7 | 53.078 | Vince Friese |
| 17 | 13th | 51.252 | 7 | 53.094 | Mike Alessi |
| 18 | 20th | 51.945 | 3 | 55.029 | Alex Ray |
| 19 | 21st | 52.107 | 5 | 53.580 | Cade Clason |
| 20 | 18th | 52.288 | 7 | 56.170 | Austin Politelli |
| 21 | 16th | 52.778 | 3 | 56.003 | Jimmy Alberston |
| 22 | 22nd | DNS | DNS | DNS | Justin Brayton |
250SX Class Lap Times
| Lap Rank | Finish | Best Lap | In Lap | Avg Lap Time | Rider |
| 1 | 22nd | 48.970 | 2 | 49.899 | Shane McElrath |
| 2 | 3rd | 49.386 | 7 | 50.467 | Aaron Plessinger |
| 3 | 1st | 49.448 | 3 | 50.459 | Justin Hill |
| 4 | 2nd | 49.681 | 6 | 50.525 | Austin Forkner |
| 5 | 4th | 49.824 | 3 | 51.292 | Jimmy Decotis |
| 6 | 7th | 50.029 | 10 | 51.669 | Martin Davalos |
| 7 | 6th | 50.186 | 10 | 51.399 | Jeremy Martin |
| 8 | 5th | 50.385 | 9 | 51.302 | Dan Reardon |
| 9 | 8th | 50.883 | 4 | 52.801 | Cole Martinez |
| 10 | 9th | 51.058 | 4 | 53.161 | Hayden Mellross |
| 11 | 12th | 51.173 | 7 | 53.725 | Ryan Surratt |
| 12 | 10th | 51.359 | 4 | 53.253 | Kyle Chisholm |
| 13 | 16th | 51.540 | 2 | 55.105 | Killian Auberson |
| 14 | 11th | 51.750 | 5 | 53.467 | Noah McConahy |
| 15 | 13th | 51.890 | 3 | 54.183 | Justin Hoeft |
| 16 | 14th | 51.959 | 4 | 54.377 | AJ Catanzaro |
| 17 | 15th | 52.350 | 3 | 54.378 | Justin Starling |
| 18 | 19th | 52.913 | 5 | 56.452 | Chase Marquier |
| 19 | 17th | 52.919 | 4 | 55.785 | Scott Champion |
| 20 | 18th | 53.253 | 10 | 55.602 | Chris Alldredge |
| 21 | 21st | 53.573 | 5 | 57.889 | Chris Howell |
| 22 | 20th | 53.624 | 5 | 57.407 | Broc Shoemaker |
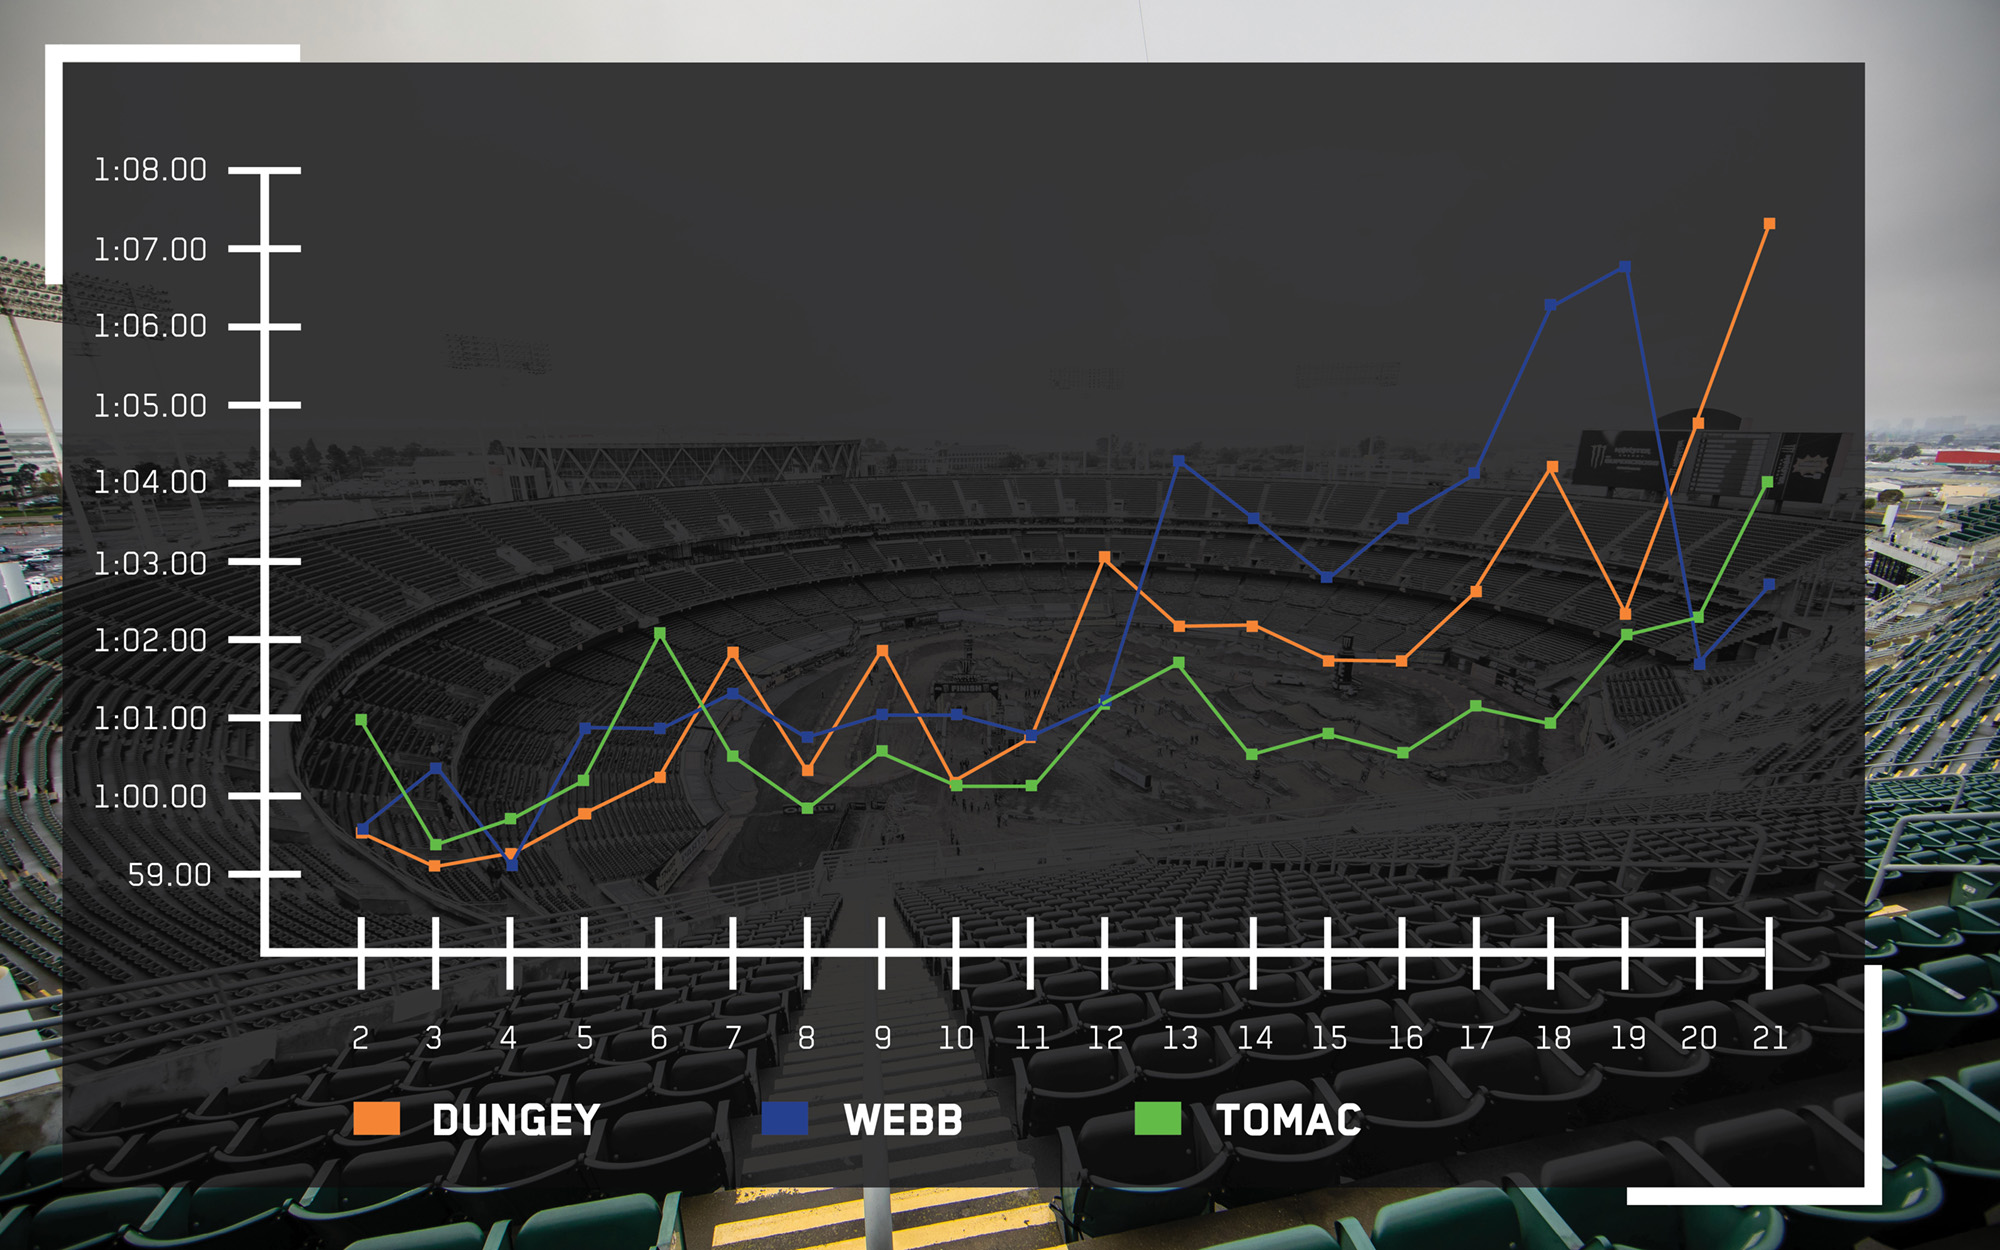
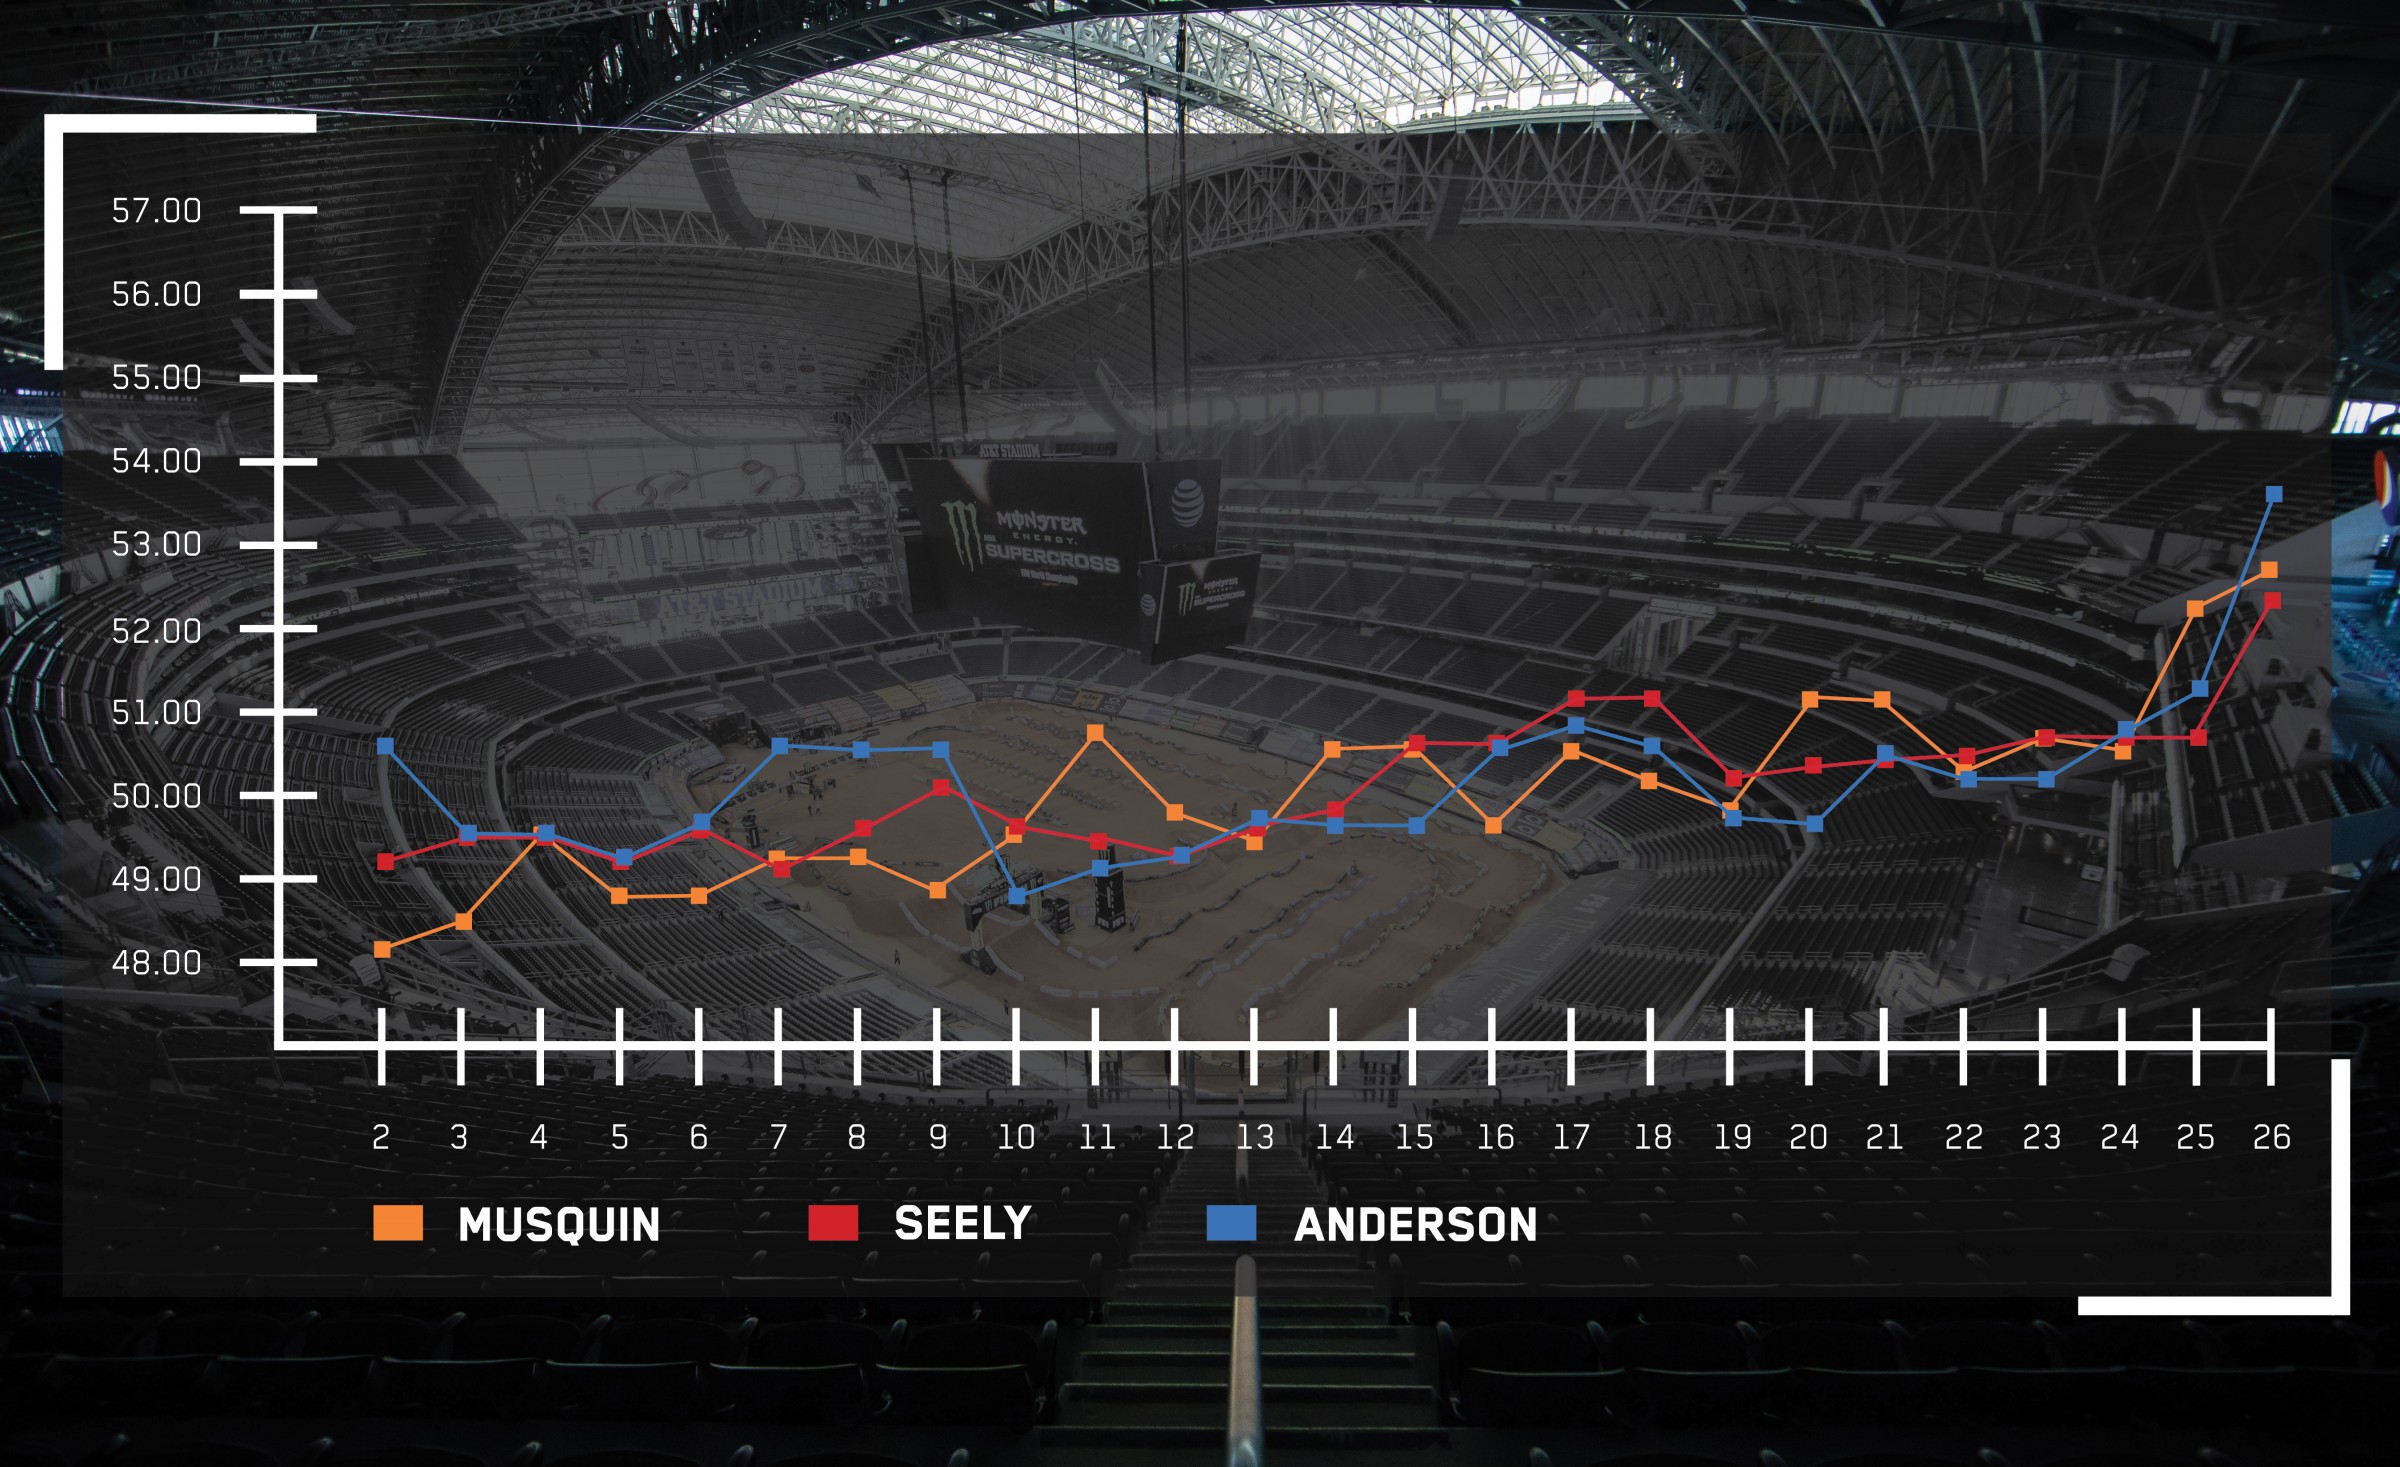
As the series moves east across the U.S. and we get away from California, we start to see drastic changes in dirt from week to week, and going from Oakland to Arlington might be the most drastic change of the year. We went from soft, rutty, rain-soaked dirt to a hard-packed track in Dallas. Take a look at how much more consistent the lap times for the top three were in Arlington compared to Oakland.
Oakland
Arlington
Note that the top three in Arlington were significantly more consistent with their lap times compared to Oakland’s rut fest. It’s no surprise that riders are able to be more consistent on dirt that changes less drastically throughout the main event. What might surprise you is the difference slippery vs. tacky dirt can also have on the rider’s heart rate. Aldon Baker has told us over the years that a rider’s heart rate will be higher on a track with tacky dirt because they are able to brake and accelerate so much harder. When the track is slick, the riders can’t gas or brake as hard, and that actually leads to saving energy. Plus, imagine how much strength is needed when fighting through the ruts on a track like Oakland. So consistent dirt and a lower heart rate equals out for a much flatter line on the graph.
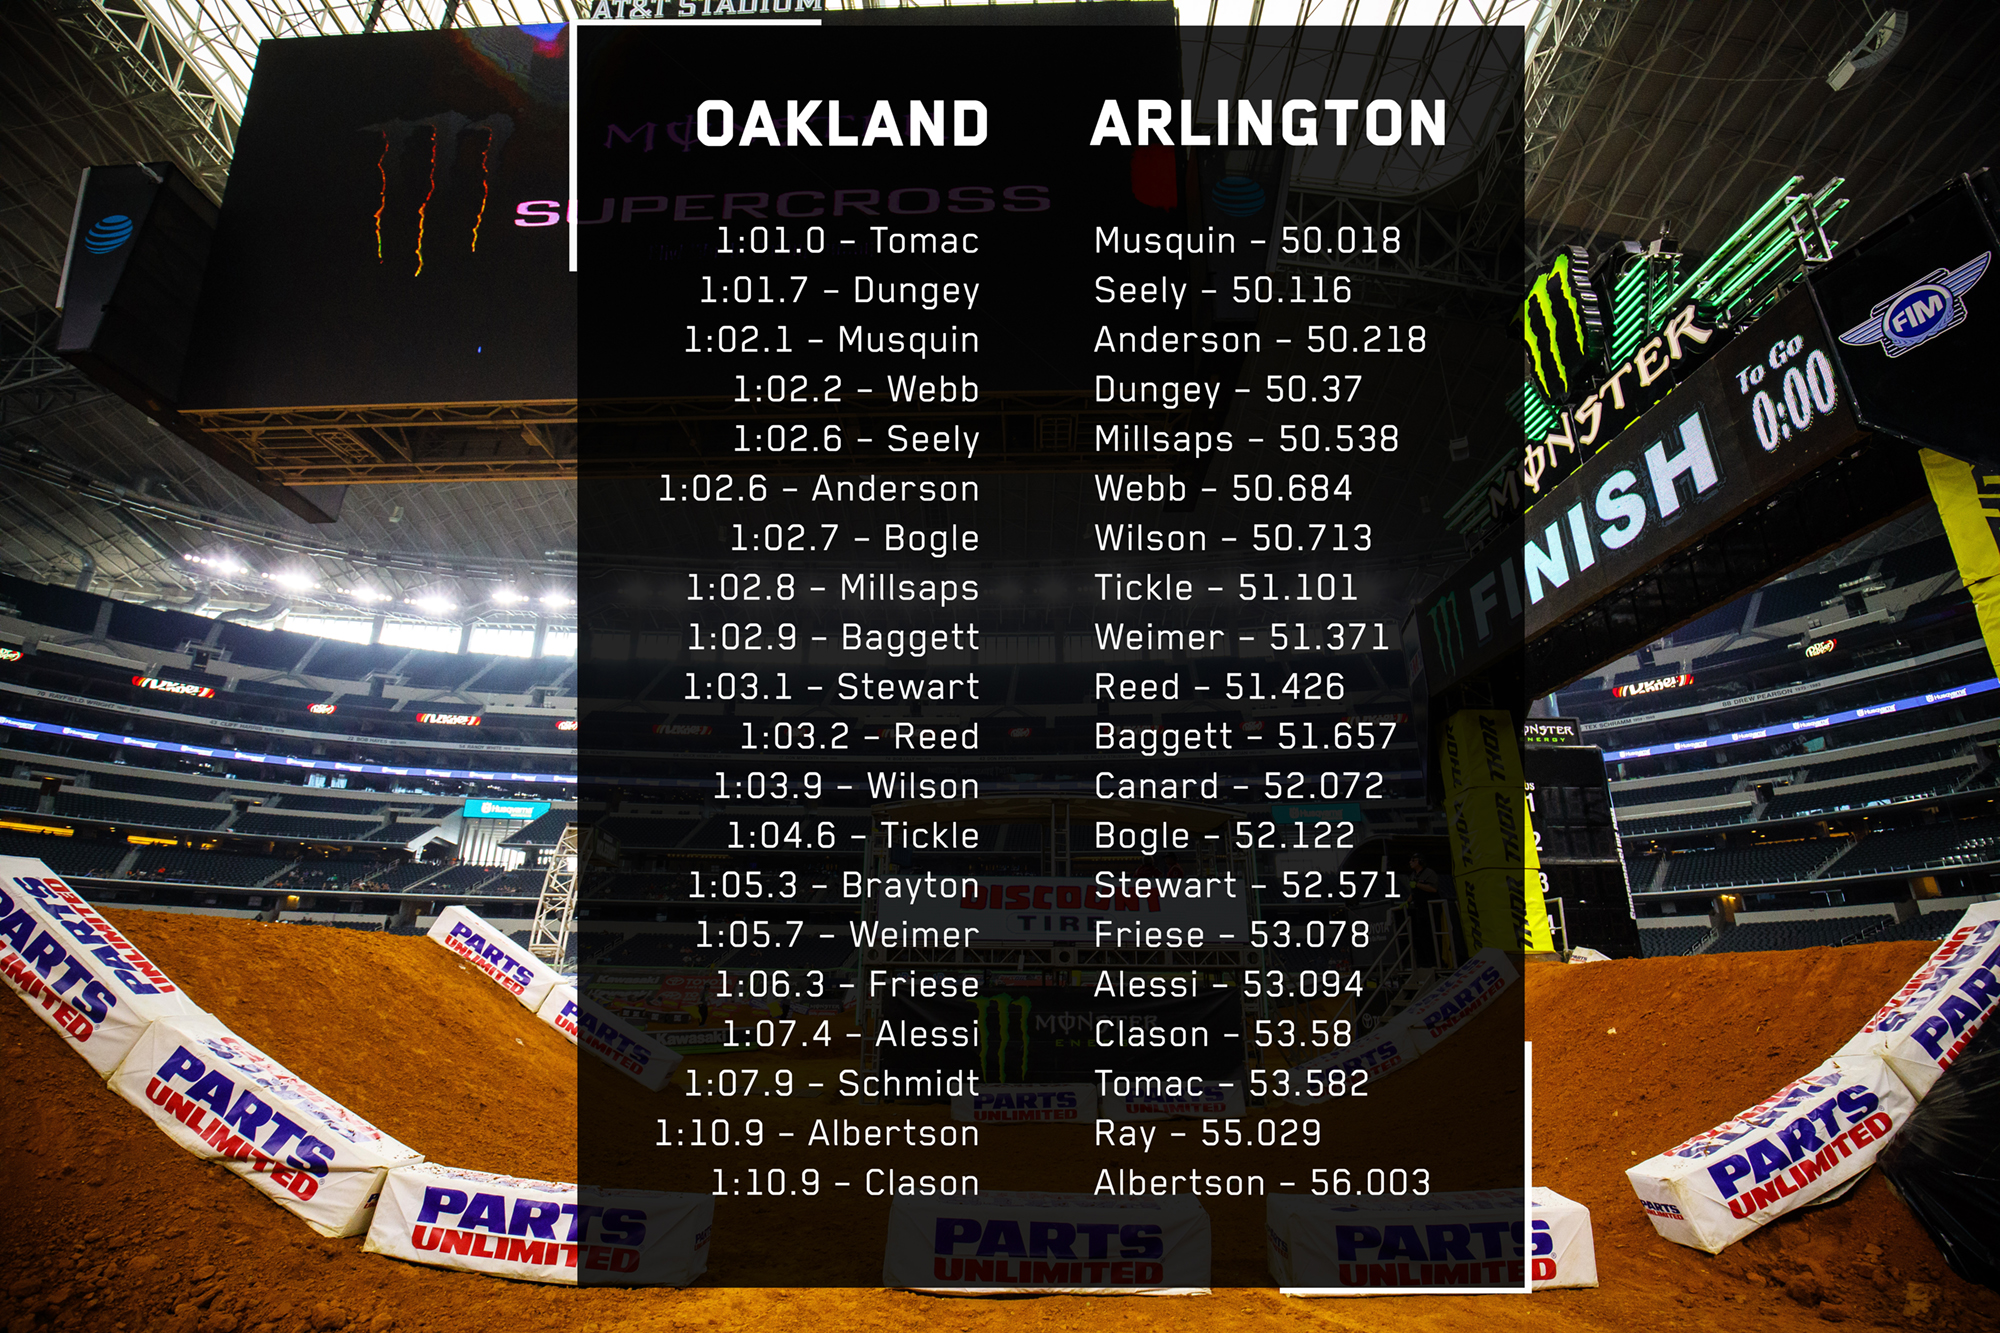
Also, take a look at the difference in average lap times from Oakland to Arlington for the entire field. The difference in averages from first to last in Oakland was nearly 10 seconds, compared to Arlington, which was only 6 seconds. Tricky conditions create big separation. Remember that time when Ricky Carmichael lapped the whole field at the Spring Creek National? It was a mud race.
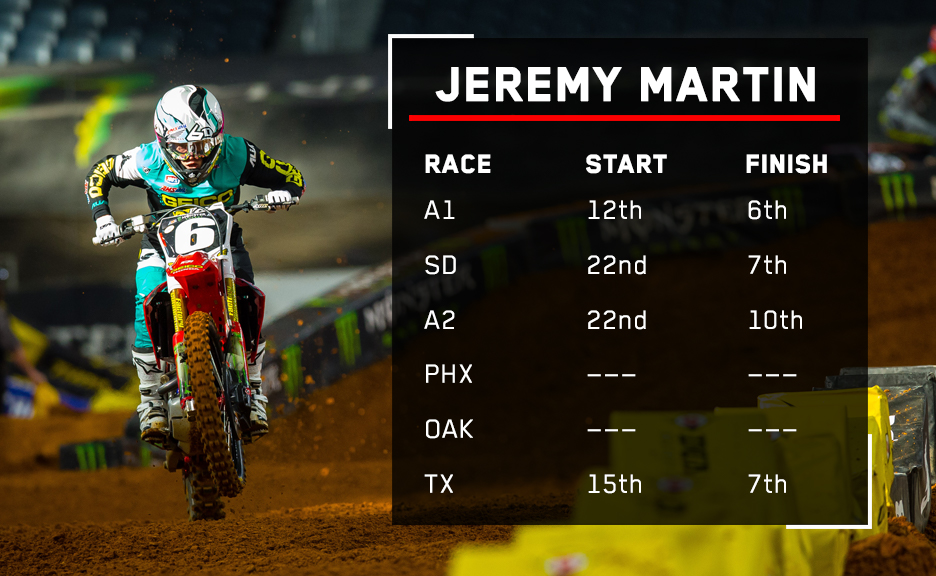
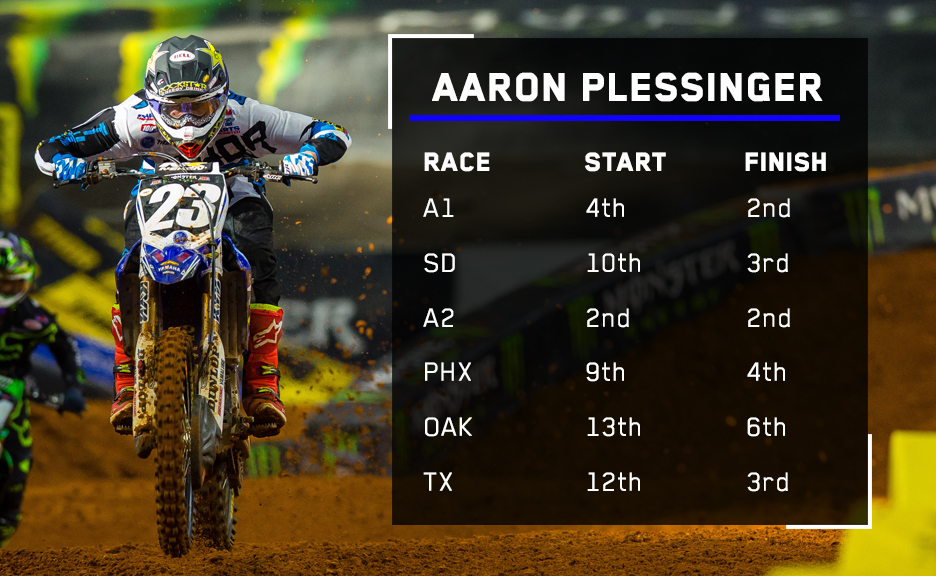
In the 250 Class we saw Justin Hill take his fourth win in a row and a dejected Shane McElrath rolling around the track with a bike malfunction, trying to salvage as many points as possible. While that drama was happening up front, Jeremy Martin and Aaron Plessinger were dealing with their own drama, but it wasn’t as surprising. Yet again, they both got terrible starts and had to charge through the pack. Take a look at each of their starts for the entire season.
Luckily for us, the camera was focused on Plessinger as he sliced he way through the pack. We got to follow him as he made his was from 11th to fifth. You might think that he made all of these passes in the whoops where he looked significantly faster than everyone, but he actually made most of his passes in the rhythm section before the whoops. Since the 250 riders went two-two to start the rhythm, Plessinger was staying low in the corner before the section which allowed him to pull up next to whoever was in front of him and control the next corner going into the triple. He made five passes there. An interesting note about the whoops, though. When Plessinger blew by Jimmy Decotis he was a full 1.07 seconds faster than him from the entrance of the first set to the last whoop of the second set. Just last week, Decotis was using the rutted whoops in Oakland to make up ground on McElrath while fighting for a podium. When the tracks and dirt change, so does everything else!

